Visual Studio Code (v1 Guide)
Created on 2021/11/03 with VSCode version 1.53.
Last revision on 2022/06/30 with VSCode version 1.68.2.
I'm not a native English speaker, so please report inconsistencies to anonymous1184.
TL;DR: 5-Minute cookbook recipe
- Download1), install, and run VSCode.
- Press Ctrl+p and type/paste
ext install mark-wiemer.vscode-autohotkey-plus-plusthen press Enter to install extension that handles.ahkfiles. - Optionally this one (if you want the optional benefits of the second extension.)): Press Ctrl+p type/paste
ext install zero-plusplus.vscode-autohotkey-debugthen press Enter. - Press Ctrl+n to create a new document and type/paste
- Save the document with
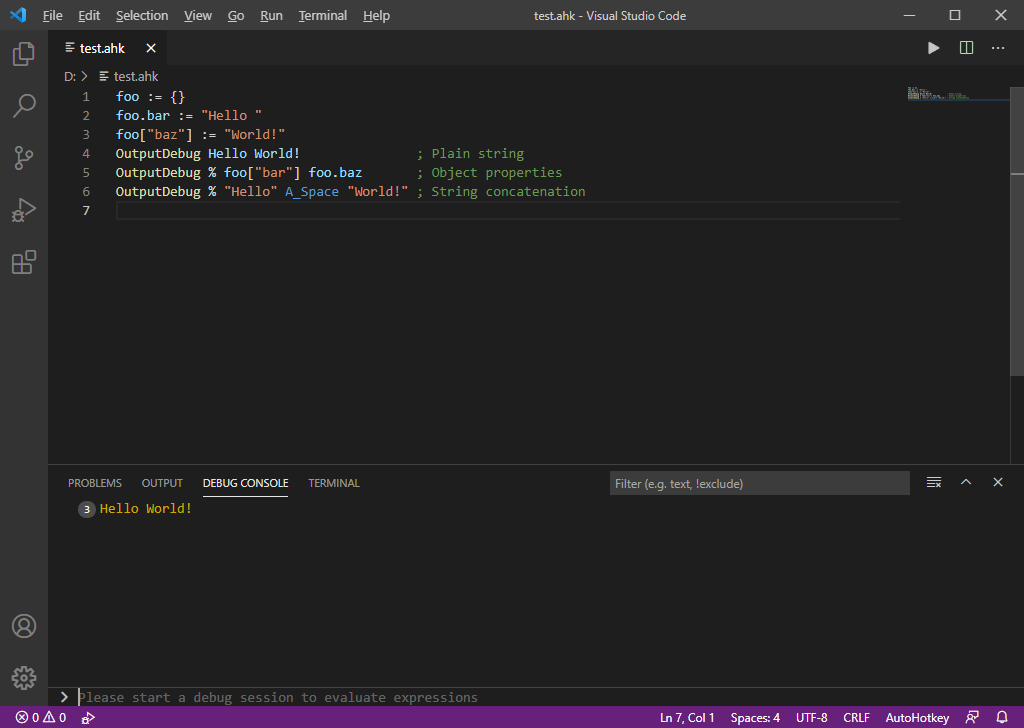
.ahkas the extension. - Press F9 to debug and see the: Debug Console
Happy debugging! *(as if…)*
Choosing a version
Depending on your OS and type of processor, you are better off with the corresponding architecture; so if you have a 64-bit OS1), use the x64 version as it would have speed improvements2) over the x86 version.
Upon clicking the Windows button (instead of the specific build), the website will make an educated guess and deliver what it considers best.
A more specific installation can be chosen between a *System* and *User* type of installation; the first option places the application in %ProgramFiles% while the other places it in %LocalAppData%.
Installing VSCode
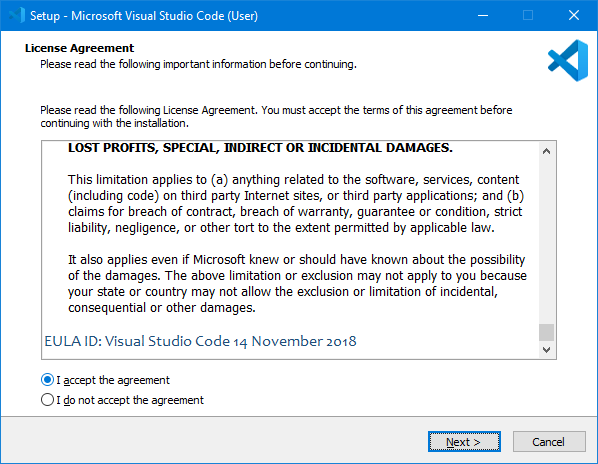
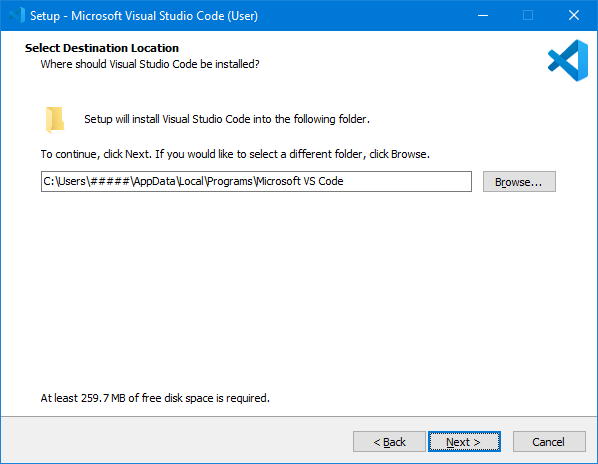
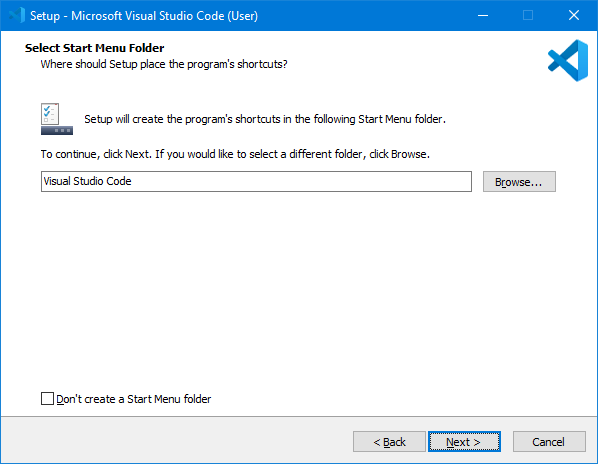
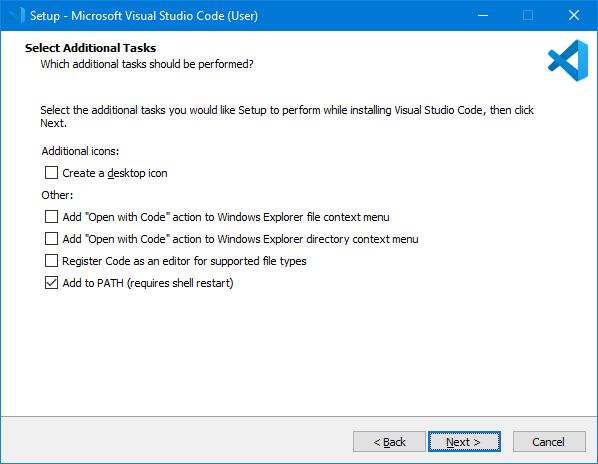
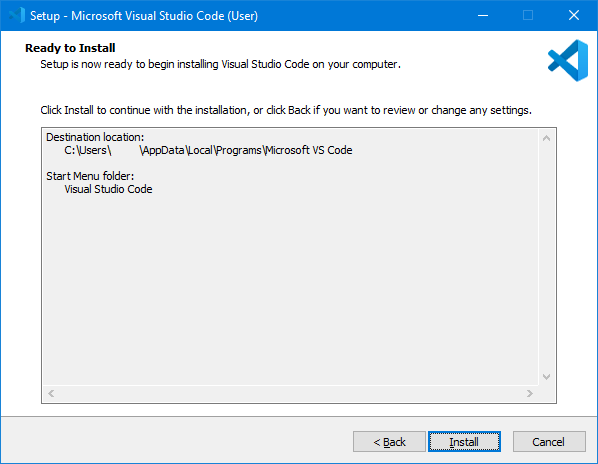
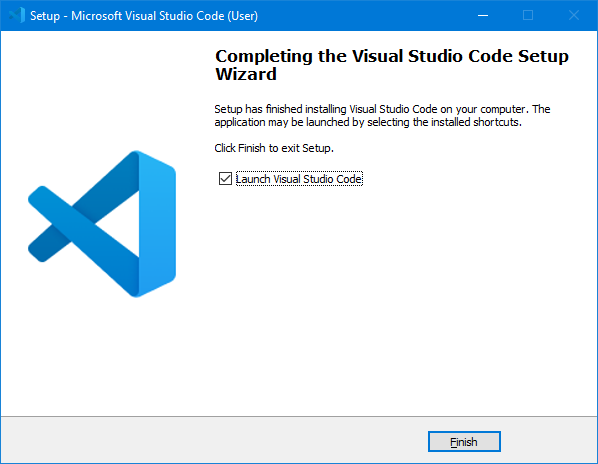
This is your basic run-of-the-mill installer with a License Agreement and a few screens, in the end you're presented with the option to launch the installed application (please do). The process is shown below:
Portable version
The AutoUpdate.ahk script below takes care of everything, just put it in an empty folder and run it, no need for manual download/decompression.
If you want to use VSCode with the same settings on more than one computer but also don't want to log in to an account or don't have administrator access (or simply feel more in control with a stand-alone installation) download either the x64 or the x86 zip archive.
Once uncompressed, create an empty directory called data (and if you desire to keep temporal files outside the current user environment create a tmp directory inside).
The possible downside of this method of "installation" is that updates are not automatic, they need to be done manually. For that purpose, placing this script in the directory will do the job:
Extensions
The core functionality of VSCode can be easily extended with the Extensions Marketplace; it is a well-established ecosystem with a wide variety of additions for different programming languages, spoken languages, data/file types, *et cetera*… worth exploring.
AutoHotkey support in VSCode is not bundled out of the box, thus extensions allow full utilization of IDE features (such as syntax highlighting, Intellisense, formatting, contextual help, debug…).
While there are a few AutoHotkey-related extensions available, the one made by Mark Weimer is the most up-to-date and actively developed. It has everything most users might need to write and debug AutoHotkey scripts. For more advanced usage look into the extension referred to in the next subtopic). It is advised to read as much as possible about what can be accomplished with the extension.
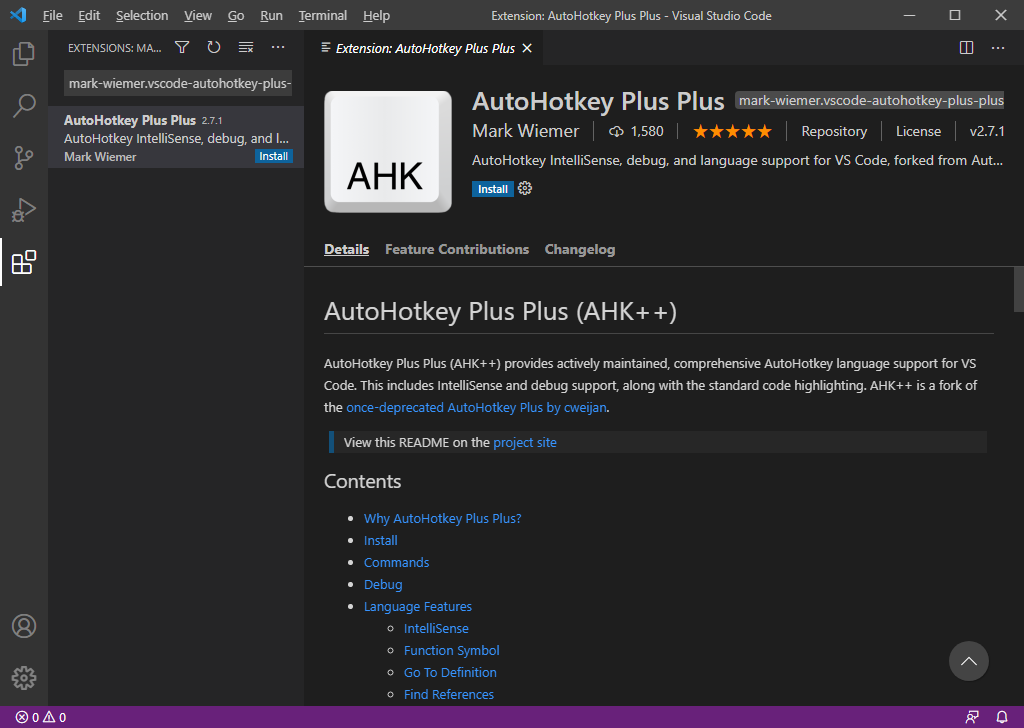
To install the required extension click "Extensions" in the "Activity Bar" (the 5th icon on the left bar, or press Ctrl+Shift+x). Type (or copy and paste) the extension id: mark-wiemer.vscode-autohotkey-plus-plus and press Enter.
AutoHotkey++
Extension: AutoHotkey Plus Plus
In order to test create a new file (press Ctrl+n) and type/paste:
- test.ahk
#Warn All, OutputDebug
hello := "Hello "
world := "World!"
OutputDebug % hello world
OutputDebug % test123test
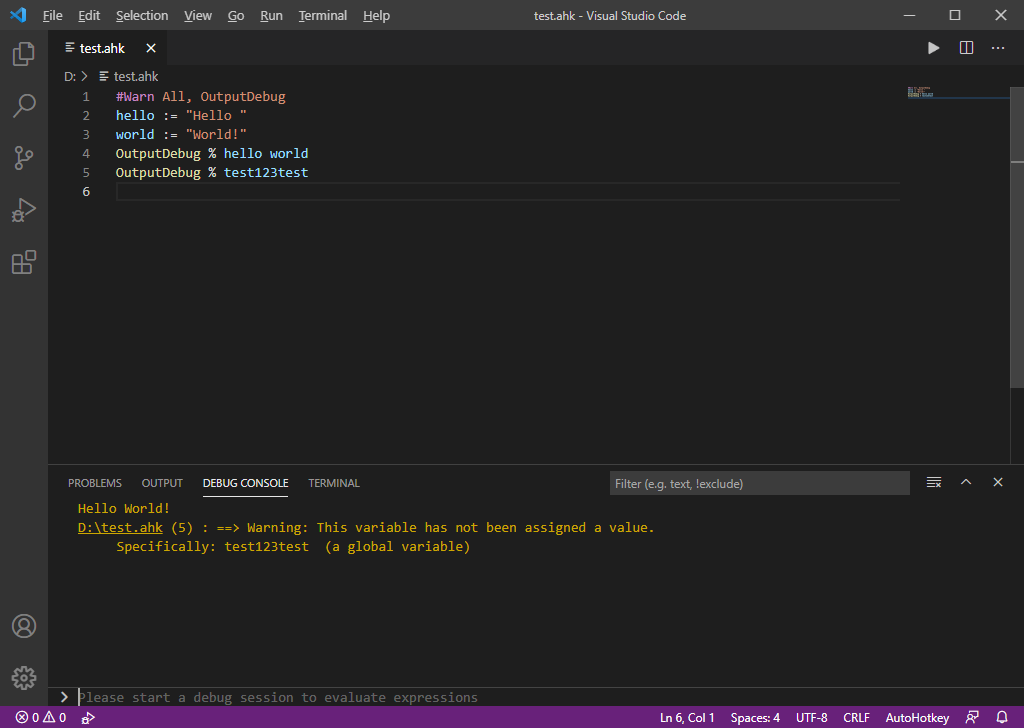
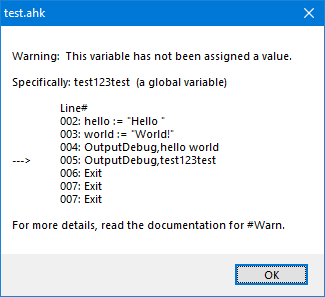
Save the file with .ahk as extension and press F91) to test the debugger. The expected result is a very unoriginal Hello World! and a warning that in the line #5 an undefined variable was called:
Normally a MsgBox would have been issued for the warning:
Optional
The following are a few extensions that have a positive impact on the overall coding experience IMO (as always YMMV). The procedure to install them is the same as before:
- Press Ctrl+p
- Type/paste
ext installfollowed by a space and the extension ID. - Hit Enter and after a few seconds, the extension is installed.
However, you could also take the scenic route to find out more about the extension's details. In that case, try the following instead:
- Click "Extensions" in the "Activity Bar" (or press Ctrl+Shift+x).
- Type/paste the extension ID, press Enter, and review.
- If you wish to proceed, click on the small
installbutton.
Bookmarks
Jumping between sections of code is something you'll always find yourself doing when dealing with files that require you to scroll is a nuance. There are of course methods to avoid manually looking through a file like the "Code Outline", "Go to Definition" or "Go to References", but what happens when you need to jump between parts in the middle of a "node"? Or simply to avoid using the mouse? Well, Bookmarks is exactly for that.
- ID:
alefragnani.bookmarks
Diff
VSCode has inline Diff support but only when working in a project with SCM configured, for chunk-based diff (with Clipboard support) Partial Diff is useful.
- ID:
ryu1kn.partial-diff
When dealing with a file as a whole and inline changes or side-to-side comparison is needed Diff will provide access to the built-in feature normally only available through the command line (Code.exe –diff path1 path2).
- ID:
fabiospampinato.vscode-diff
Overtype
This is the first editor I've used without native support for overtype, weird.
- ID:
adammaras.overtype
Sublime Text keymap
If you ever used Sublime Text Editor and got used to its bindings, a must is to keep consistency or avoid re-training muscle memory. A big plus of this extension is that it imports/translates the configuration of Sublime Text into VSCode.
- ID:
ms-vscode.sublime-keybindings
vscode-autohotkey-debug
While Mark's extension is more than enough for the majority of users, I've found that the (unnamed) extension provided by zero-plusplus has a broader set of functionality aimed at more nitpicking/advanced users. Again, take your time to read and consider if this extension provides an improvement over what's already on the table (a comparison between the two is out of the scope of this guide).
- ID:
zero-plusplus.vscode-autohotkey-debug
Usage Examples
This is not a comprehensive tutorial, but a quick guide aimed at covering the basics of how to effectively enable and utilize AHK debugging support in VSCode.
OutputDebug
OutputDebug simply sends an evaluated expression in the form of a string to the connected debugger for display in the console:
- test.ahk
foo := {}
foo.bar := "Hello "
foo["baz"] := "World!"
OutputDebug Hello World!               ; Plain string
OutputDebug % foo["bar"] foo.baz       ; Object properties
OutputDebug % "Hello" A_Space "World!" ; String concatenation
Additional benefits against methods like:
MsgBox: it doesn't halt code execution.ToolTip: you can print/review several lines.FileAppend: no need to keep "tailing" a log file.
To halt code execution, we have Breakpoints
Breakpoints
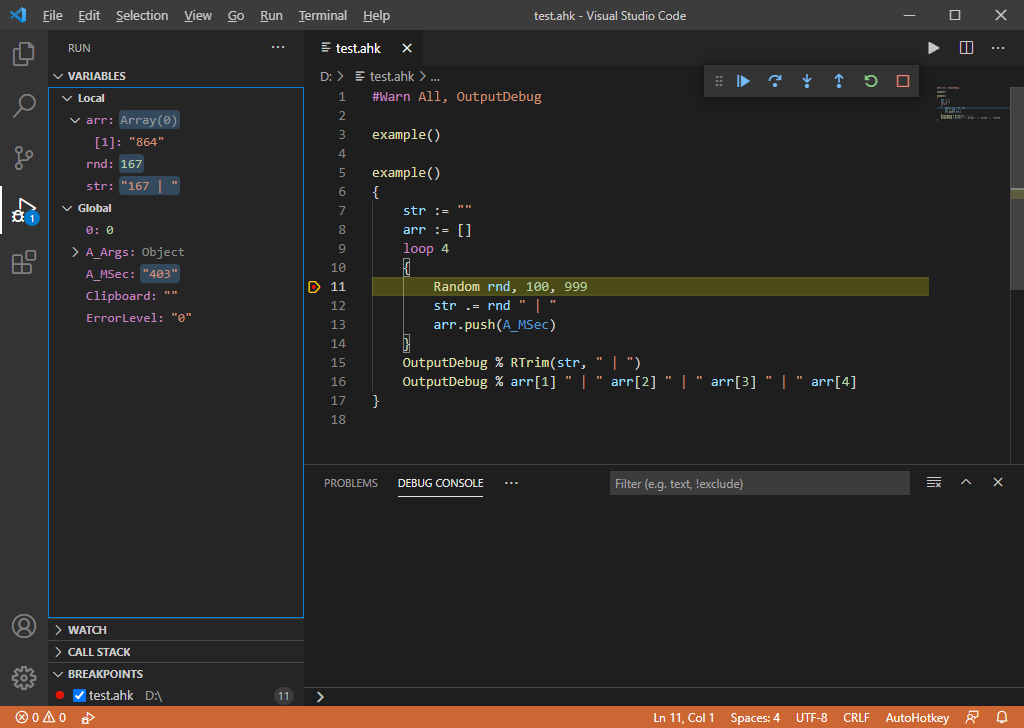
Breakpoints allow the user to stop at any given line and inspect the code mid-execution, enabling manual review and modification of variables on-the-fly for any scope.
To set a breakpoint click to the left of the line numbers, or set up a keyboard shortcut (look for Debug: Toggle Breakpoint) the default F9 is overwritten but you can fix it.
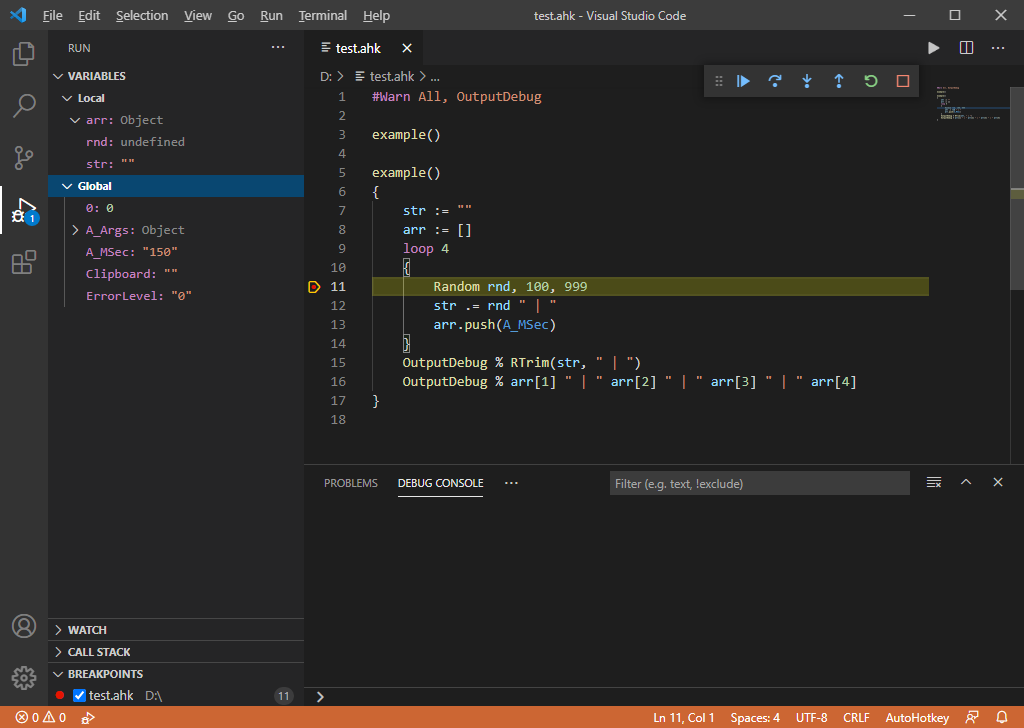
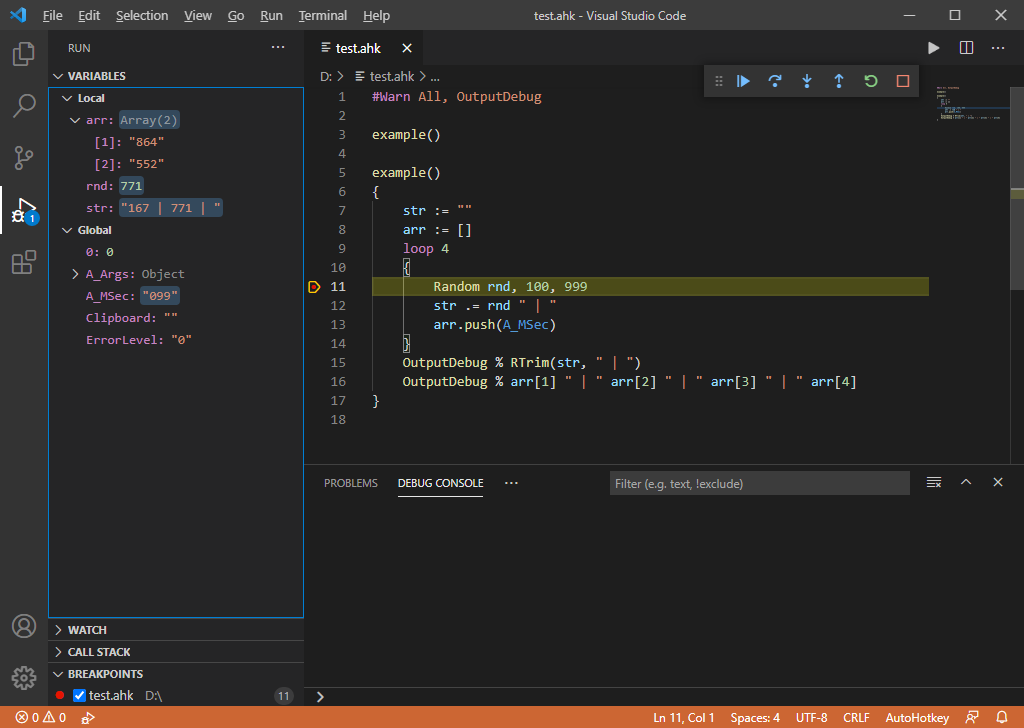
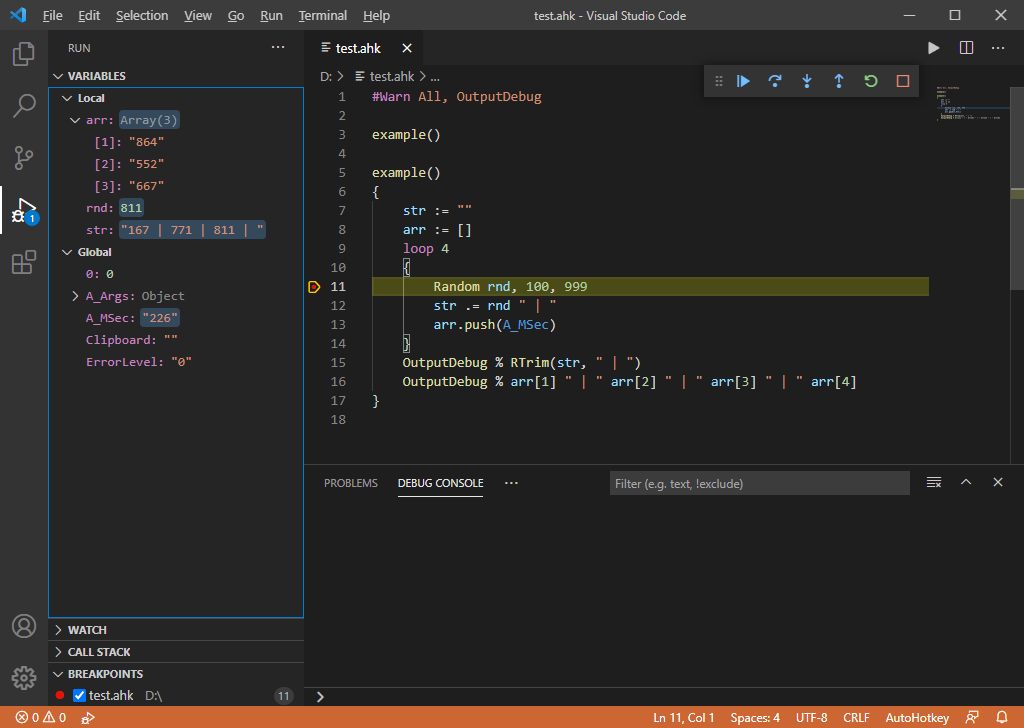
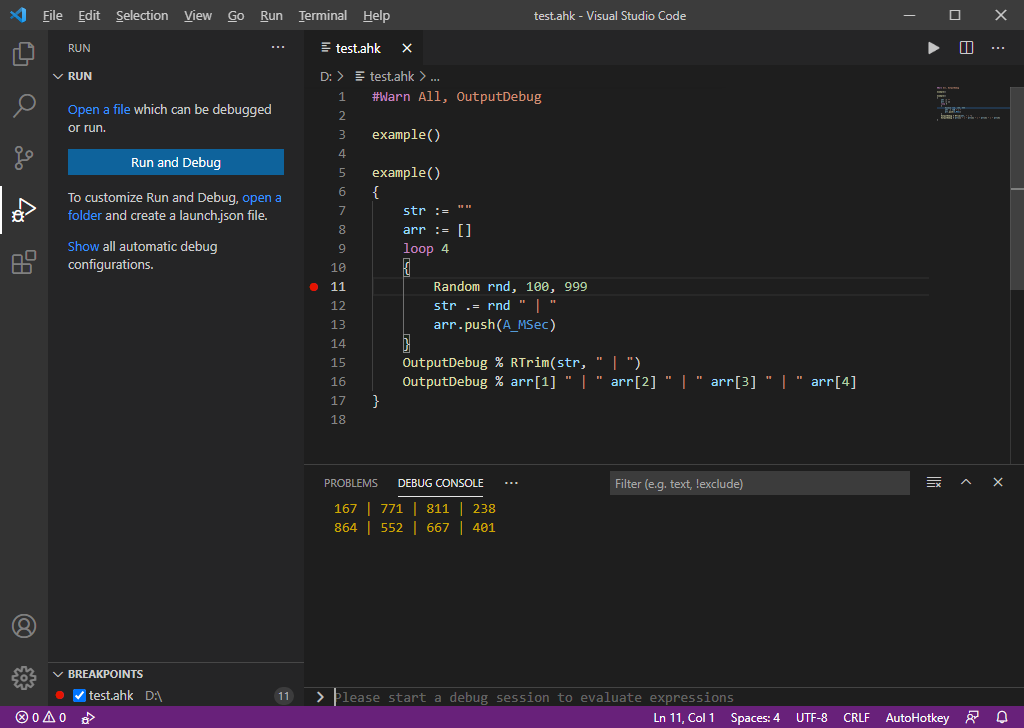
Breakpoints can be set in any line but if they are set in comments or directives the interpreter will stop in the next available statement. In the following example, a breakpoint is set inside a loop, inside a function.
After setting the breakpoint, start the debugger by:
- Press F5.
- From the menu: Run > Start Debugger.
- Clicking the "play" button on the top right corner.
Debug Actions
The basic actions on the vast majority of debuggers are:
- Continue: Resumes the execution until the next breakpoint or end of the thread.
- Step Over: Evaluates the next statement ahead.
- Step Into: Goes inside the next statement (if user-defined).
- Step Out: Continues to the upper layer in the stack.
More
For a more robust guide, please refer to the VSCode Documentation where you can read about Evaluation (directly in the console), "Variable Watch", "Call Stack", how to monitor variable values and set (Conditional1)) Breakpoints at different layers of the stack when "tracing".
After this point, virtually every debugging tutorial explains the same concepts (once you remove language from the equation). For even more details: search engines, forums, subreddits, IRC/Discord servers, etc. can be of great help.
vscode-autohotkey-debug extension
Profiles
Profiles can be set to test various versions of AHK (ANSI, Unicode x86/x64, AHK_H, v2) and to start debugging a specific file (instead of the one currently in the editor). Click the "Run" icon in the "Activity Bar" (or press Ctrl+Shift+d) and click on the create a launch.json file link, a boilerplate will be created:
type: must beahk.name: is a free label.request: must belaunch.program: a path to a script supports predefined variables1).runtime: is the binary used to start the debugging process2).stopOnEntry: true to stop on the first line even without a breakpoint.
To add profiles just add objects into the configurations array:

